
Chiller Pull Down Time: the Question the Datasheet Does Not Answer
Capacity tables answer a steady-state question: how much heat the machine removes once it is at temperature. The question a lab actually asks on Monday morning is transient: how long from switch-on until the loop is at −20 °C and the instrument can start. That is pull down, and no single datasheet number gives it, because it depends on things the manufacturer cannot know — how much coolant, how much metal, how much bath volume the loop carries, and what temperature the room left it at overnight.
Chiller pull down time is still estimable to useful accuracy with two inputs and one honest complication. The inputs are the loop’s thermal mass and the machine’s capacity. The complication is that the capacity is not one number: it falls as the loop gets colder, so the last ten degrees cost far more time than the first ten. This guide works the estimate, names what stretches it, and ends with the one measurement worth recording at commissioning.
The Physics in One Paragraph
Cooling a loop means removing stored heat. The heat stored per degree is the sum of every mass in the circuit times its specific heat — coolant, reservoir, bath fluid, tubing, and the wetted metal of whatever the loop serves. The removal rate is the machine’s net capacity at the loop’s current temperature, minus whatever heat leaks in through insulation and hoses. Divide stored heat by net rate and you have time — but the rate falls as the temperature falls, so the division has to be done in steps, not once.
Why the rate falls is refrigeration, not marketing: as the evaporator runs colder, the refrigerant’s suction density drops and the compressor moves less mass per stroke. A machine rated 450 W at 0 °C may deliver a fraction of that at −30 °C. The capacity-versus-temperature curve on the product page is the shape of your pull down, and reading it is most of the work.
A Worked Example to −20 °C
All values are assumed for illustration; substitute your own loop’s numbers.
| Input | Value used | Basis |
|---|---|---|
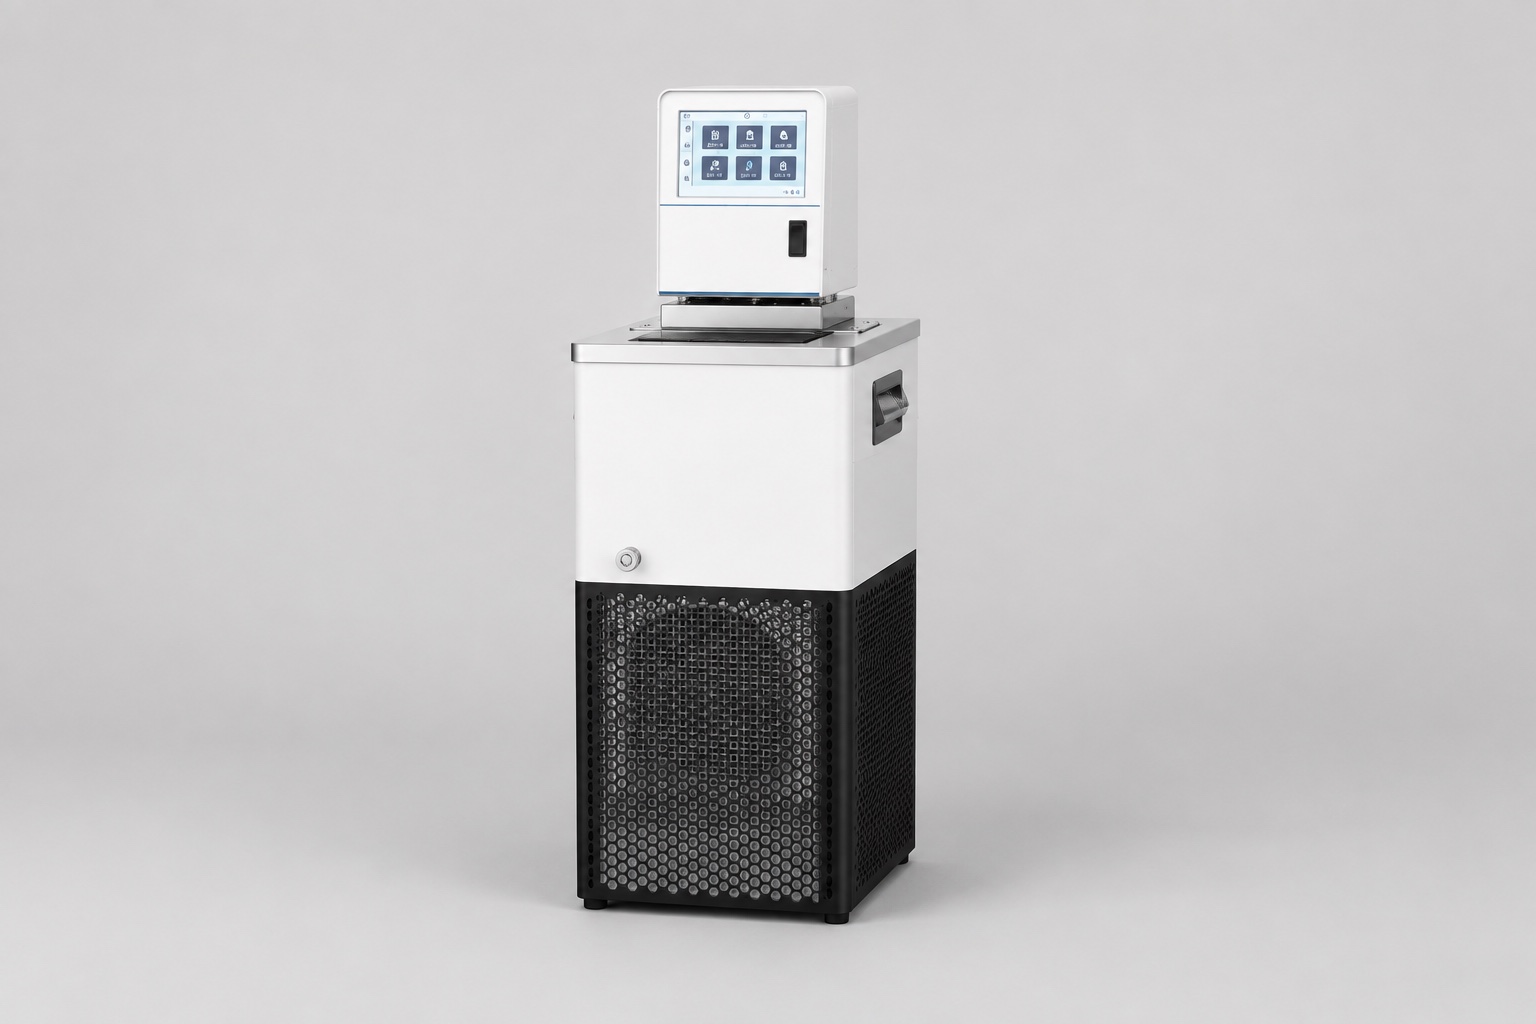
| Machine | MiniCool-class, 450 W nominal, 0 to −40 °C published range | Published range |
| Coolant volume | 4 L of 40/60 glycol-water | Assumed; ~15 kJ/K |
| Wetted metal and bath | Equivalent to another 10 kJ/K | Assumed |
| Start / target | +20 °C → −20 °C | Assumed |
| Ambient leak-in near target | 40 W | Assumed, insulated loop |
| Capacity at 0 / −10 / −20 °C | 450 / 320 / 210 W | Assumed shape for illustration |
 The workings are stepwise, ten degrees at a time. Total thermal mass is 25 kJ/K, so each 10 K step stores 250 kJ.
| Step | Mean net capacity | Time for the step |
|---|---|---|
| +20 → +10 °C | ~470 W (capacity high, little leak-in) | ~9 min |
| +10 → 0 °C | ~430 W | ~10 min |
| 0 → −10 °C | ~350 W | ~12 min |
| −10 → −20 °C | ~225 W gross − 40 W leak ≈ 185 W | ~23 min |
| Total | ~54 min |
The shape is the lesson more than the total: the last step takes as long as the first two together, because falling capacity and rising leak-in squeeze the net rate from both sides. Any estimate that divides once by the nominal rating — 250 kJ × 4 steps ÷ 450 W ≈ 37 minutes — looks plausible and lands short by a third, always in the optimistic direction.
What Stretches Chiller Pull Down Time
- Bath and load mass you forgot to count. An instrument’s internal bath, a jacketed vessel’s contents, a metal stage — anything the loop touches is part of the thermal mass. The coolant is often the minority shareholder.
- Viscosity at the cold end. Glycol mixtures thicken steeply below 0 °C; flow falls, film coefficients fall, and the real curve sags below the stepwise estimate in the last segment.
- Warm rooms and poor rejection. Condenser inlet temperature raises condensing pressure and cuts capacity across the whole curve — the same machine pulls down measurably slower in a 30 °C room than a 20 °C one.
- Uninsulated runs. Leak-in scales with the temperature difference, so it is at its worst exactly when capacity is at its least, at the bottom of the pull.
- Controller behavior near setpoint. Machines soft-land: the final degree or two under proportional control takes disproportionate clock time, though the loop is usually usable before the display says arrived.
Reading a Capacity Curve for This Purpose
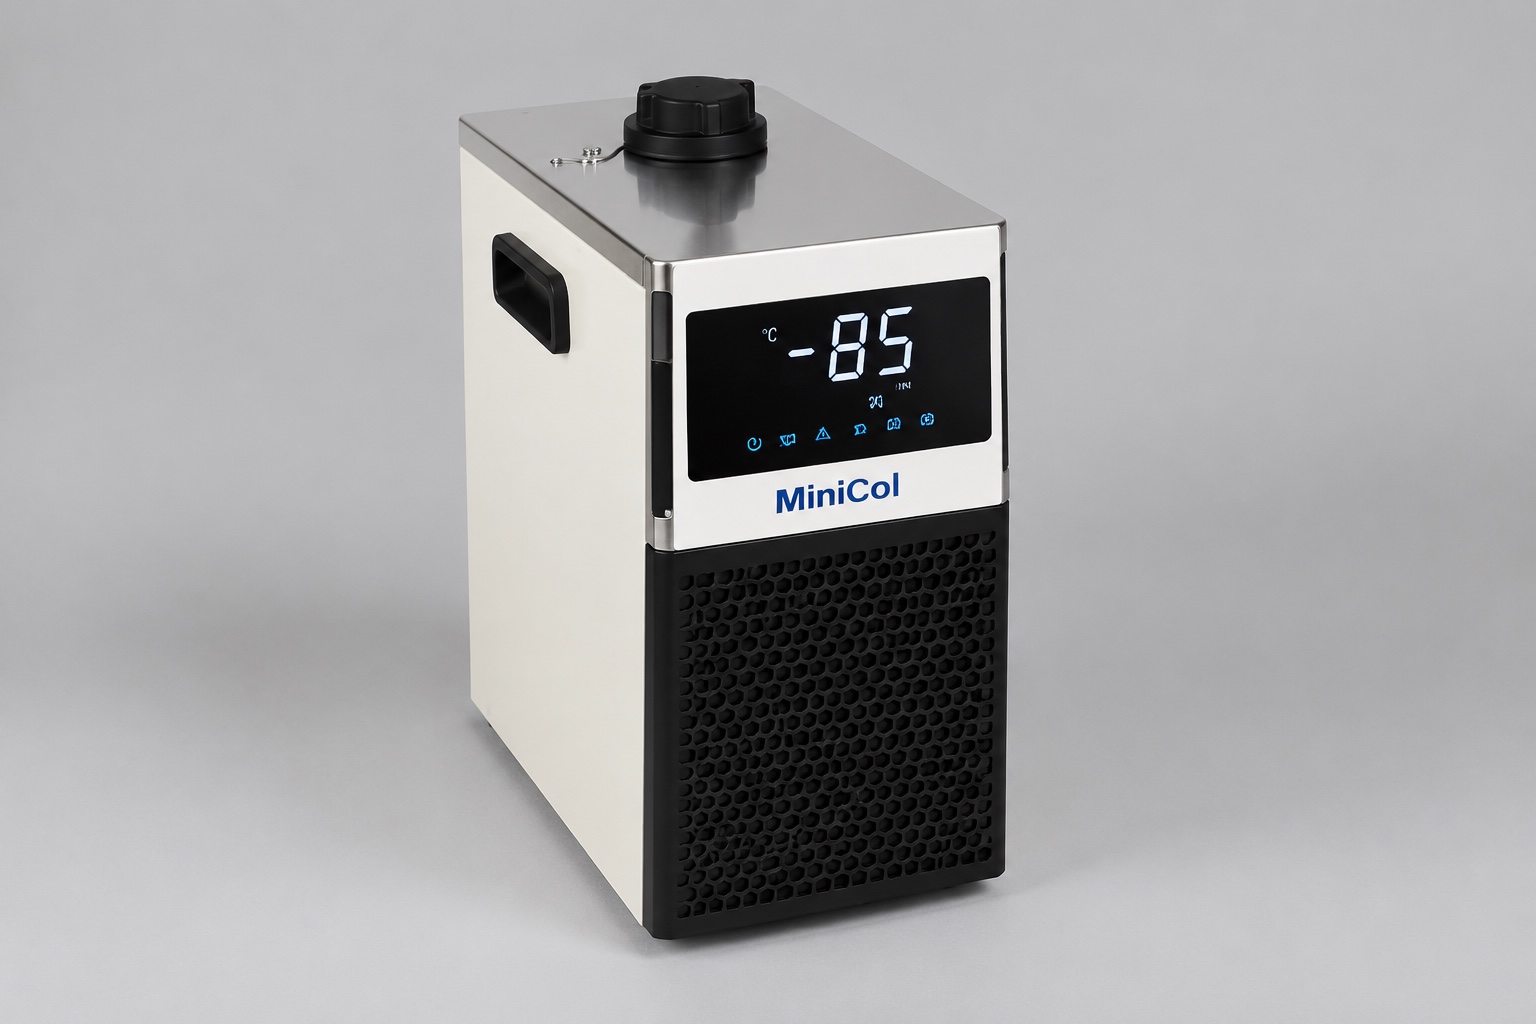
Product pages for sub-zero machines publish capacity at several temperatures — the MiniCool range spans 450 to 850 W across a 0 to −40 °C envelope, with the applicable figure falling as setpoint falls. For estimation, three habits keep the reading honest:
- Take capacity at the step’s temperature, not the target’s — using the −20 °C figure for the whole pull double-counts the penalty, and using the 0 °C figure ignores it.
- Subtract leak-in near the cold end, where it matters; ignore it near the start, where it does not.
- Treat the result as a floor-to-ceiling band, not a promise: viscosity, room temperature and controller landing all sit outside the arithmetic, and all push one way — longer.
A margin of 30 to 50 percent over the stepwise total is a reasonable planning allowance (assumed practice, not a specification). If the workflow cannot tolerate the answer — if the instrument must be cold in twenty minutes, not sixty — the levers are a bigger machine, less thermal mass, or not warming up in the first place.
Running the Estimate Backwards: Sizing from a Deadline
The same arithmetic selects a machine when the requirement arrives as a deadline rather than a question. If the workflow says the loop must be at −20 °C within thirty minutes of switch-on, the stepwise table inverts: divide each step’s stored heat by the time budget you can give that step, and the result is the net capacity the machine must deliver at that step’s temperature.
Run that on the worked example with a 30-minute total and the requirement lands hardest where machines are weakest: the final step needs roughly 415 W net at −15 °C mean, which after leak-in means a machine delivering about 455 W at that temperature — more than twice what the 450 W-nominal class offers there. The candidate is no longer the machine whose nominal rating matches the steady load; it is the one whose curve clears the requirement at the cold end, and that is typically a class or two larger.
Three consequences follow for selection. First, chiller pull down time requirements are cold-end capacity requirements in disguise — compare candidates at the target temperature, never at nominal. Second, a machine sized generously for pull down carries large steady-state margin afterward, which is not waste: it is what holds setpoint flat when the instrument’s load steps. Third, if the deadline forces an implausibly large machine, revisit the deadline’s real owner — it is often a workflow convention rather than a process requirement, and the setback strategy below dissolves it for less money than a compressor class.
The Cheapest Lever Is Overnight Setback
Where morning readiness is the actual requirement, the alternative to pulling down faster is not being warm. Holding the loop at a setback temperature overnight — say −5 °C instead of −20 °C (assumed) — costs a small steady input at high capacity and converts the morning pull into a short final descent through the slowest part of the curve only partially. Whether it pays depends on energy cost against instrument time, but it is the only lever that changes the morning number without changing the hardware.
The other scheduling lever is honest expectations: if the loop is usable at −18 °C, start the run there while the controller lands the last two degrees. Waiting for the display to read exactly −20.0 is often the longest free delay in the building — and whether the process genuinely needs the final two degrees before starting is a question worth asking the method, not the habit.
Verify Once, Then Trust the Number
 Recording one number at commissioning turns all of this from estimate into fact: time from switch-on at room temperature to setpoint, with the loop in its normal configuration, and the room temperature noted alongside. That measured chiller pull down time is worth more than any calculation because it embeds every term — mass, curve, viscosity, leak-in, controller — at once.
It then earns its keep twice over:
- As a scheduling fact: the Monday question is answered by the logbook, not by re-estimation.
- As a diagnostic baseline: a pull that lengthens over months with a normal refrigerant side points at the fluid — the degradation path covered in our coolant selection guide, where viscosity and fouling do their slow work. A wrong glycol ratio shows up the same way, which is why the ratio guide pairs a refractometer with the stopwatch.
For positive-temperature loops the same stepwise logic applies with a flatter curve — the DV compact liquid chiller family (100–550 W, −20 to +20 °C) loses less capacity across its span, so single-division estimates land closer there than they ever will at −40 °C.
If you want a pull-down estimate checked against a real machine curve, send the following and our engineers will advise: coolant type and volume, what the loop serves and its approximate wetted mass, start and target temperatures, room temperature range, and how much morning delay the workflow can absorb. Send your loop details to our engineering team.
Frequently Asked Questions
How long should a lab chiller take to reach −20 °C?
For a small insulated loop on a 450 W-class machine, somewhere in the region of an hour is a representative order of magnitude — but the honest answer is stepwise arithmetic on your own loop’s thermal mass against the machine’s capacity curve, plus margin. The illustrative example above lands at about 54 minutes for 25 kJ/K of mass, and every added liter of coolant or kilogram of wetted metal stretches it.
Why does the last part of pull down take so long?
Two curves cross the wrong way: refrigeration capacity falls as the evaporator runs colder, while heat leaking in from the room rises with the growing temperature difference. Net removal rate gets squeezed from both sides, so the final ten degrees can cost as much time as the first twenty. Glycol viscosity rising at the cold end adds a third squeeze on flow.
Can I just divide stored heat by the rated capacity?
Only as a lower bound. Single division by the nominal rating ignores the capacity fall with temperature and always lands optimistic — in the worked example, by about a third. Stepwise division against the capacity curve, ten degrees at a time, costs five minutes with a spreadsheet and lands in the right neighborhood.
Does room temperature really change chiller pull down time?
Twice over. A warmer room raises condensing pressure and cuts capacity along the entire curve, and it steepens leak-in at the cold end. The same machine and loop can show meaningfully different pull-down clocks summer against winter, which is why the commissioning measurement should record ambient alongside the time.
What is the fastest way to shorten morning pull down?
Do not start warm. An overnight setback hold at a mild sub-zero temperature converts the morning pull into a short descent, and it spends its energy in the fast part of the capacity curve. After that, the levers are reduced thermal mass, better insulation on the cold run, a cooler equipment room, and finally a larger machine — in roughly that order of cost.
My chiller’s pull down has slowed over time — is it failing?
Check the fluid before the machine. Rising coolant viscosity from degradation, a drifted glycol ratio, or fouled cold passages all lengthen pull down while refrigerant-side readings stay normal. Compare against your commissioning baseline under similar ambient; if the refrigerant side checks out and the fluid is aged or off-ratio, the stopwatch is telling you about chemistry, not compressors.