
Total Cost of Ownership for Laboratory Cooling: A Procurement Framework for Engineers and Lab Managers
When a laboratory requisitions a recirculating chiller, the purchase order captures the equipment price — typically $1,500 to $5,000 for compact units suitable for benchtop applications. What it does not capture is the total cost of ownership (TCO): the cumulative expense of purchasing, operating, maintaining, and eventually replacing the cooling system over its useful life. For cooling equipment that runs 2,000+ hours per year for 10–15 years, the operating cost frequently exceeds the purchase price by a factor of 3–5×.
This article provides a structured TCO framework that procurement teams, laboratory managers, and engineers can use to evaluate competing cooling solutions on a level playing field — comparing not just sticker prices, but the full economic impact of each option across its lifecycle.
The Five Components of Cooling TCO
A complete TCO model for laboratory cooling includes five cost categories, each of which must be estimated over the expected useful life of the equipment (typically 10–15 years for quality recirculating chillers):
1. Capital Expenditure (CapEx)
The purchase price of the cooling equipment, including any required accessories (tubing, fittings, insulation, glycol coolant). For recirculating chillers, this is the dominant cost only in year one — and often the smallest component of the 10-year TCO.
| Equipment Class | Typical Purchase Price | Accessories & Installation | Total CapEx |
|---|---|---|---|
| Compact benchtop chiller (450W–1kW) | $1,500–$2,200 | $50–$150 | $1,550–$2,350 |
| Mid-range chiller (1.3–4.6kW) | $2,200–$3,600 | $100–$250 | $2,300–$3,850 |
| High-capacity chiller (5–10kW) | $5,000–$12,000 | $200–$500 | $5,200–$12,500 |
2. Energy Cost (OpEx — Electricity)
The ongoing electricity cost of running the compressor, pump, fans, and controller. Energy cost is a function of four variables: the chiller’s average power draw, the number of operating hours per year, the electricity rate, and the chiller’s efficiency at the typical operating point.
The key insight for energy cost estimation is that chiller power draw varies significantly with operating temperature and load:
- At moderate setpoints (10–20°C) with light loads, a BLDC variable-speed compressor may draw only 30–50% of rated power as it modulates down to match the load.
- At deep sub-zero setpoints (-30°C to -40°C) with full load, the compressor runs continuously at or near maximum power.
- During standby (setpoint reached, minimal load), power draw drops to pump and controller only — typically 50–100W.
| Operating Scenario | Avg Power Draw | Annual Hours | Annual kWh | Annual Cost (@$0.12/kWh) |
|---|---|---|---|---|
| Light use (10°C setpoint, 4 hrs/day) | 200W | 1,000 | 200 | $24 |
| Moderate use (0°C setpoint, 8 hrs/day) | 500W | 2,000 | 1,000 | $120 |
| Heavy use (-20°C setpoint, 8 hrs/day) | 1,000W | 2,000 | 2,000 | $240 |
| Deep cold (-40°C, continuous) | 1,500W | 4,000 | 6,000 | $720 |
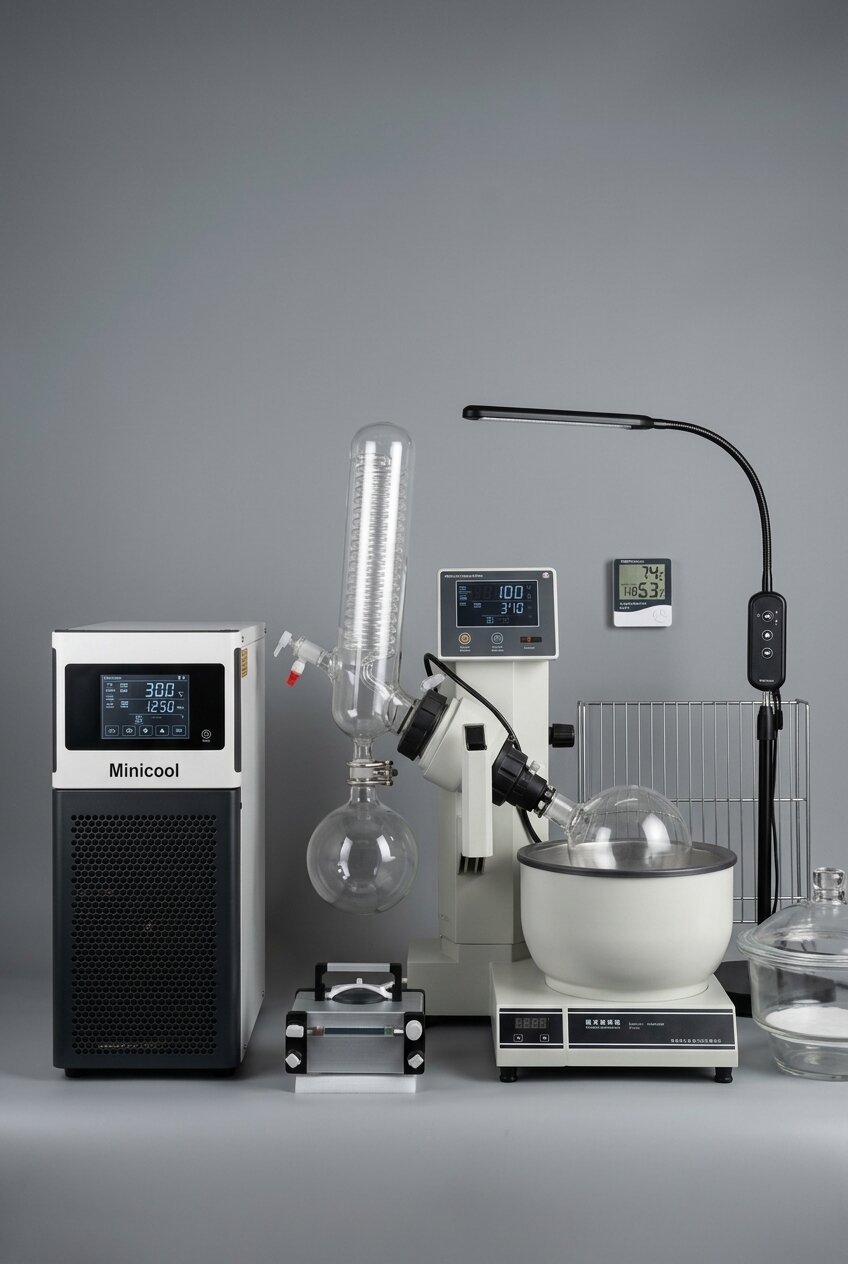
3. Consumables and Maintenance (OpEx — Materials)
Recirculating chillers have minimal consumable requirements compared to alternative cooling methods. The primary recurring costs are:
- Coolant replacement: Water/glycol mixture, replaced annually or when pH drops below 7.0. Cost: $20–$50 per fill for most laboratory chillers.
- Air filter cleaning/replacement: Condenser air filters should be cleaned monthly and replaced annually. Cost: $10–$30 per filter.
- Preventive maintenance inspection: Annual check of refrigerant charge, electrical connections, and pump performance. Cost: $50–$150 if performed by a service technician, or zero if done in-house with manufacturer’s checklist.
Total annual consumable and maintenance cost: $80–$230 for most laboratory chillers. Over 10 years: $800–$2,300.
4. Downtime Cost (Indirect)
When a chiller fails, the instrument it serves cannot operate. For a research laboratory, downtime delays experiments. For a production or QC laboratory, downtime delays product release. The cost of downtime is application-specific but can be estimated:
- Research lab: Researcher salary ($40–$80/hr) × hours of delayed work. A 2-day chiller outage affecting one researcher costs $640–$1,280 in direct labor, plus potential reagent waste and schedule disruption.
- QC/production lab: Product release delay costs vary enormously by industry. Pharmaceutical batch release delays can cost $10,000–$100,000+ per day.
Well-designed chillers with BLDC compressors, quality components, and 30,000–50,000 hour rated lifespans minimize downtime risk. Cheaper units with shorter lifespans or less reliable components may save $500–$1,000 on purchase price but cost multiples of that in unplanned downtime over their shorter lives.
5. Disposal and Replacement (End-of-Life)
Refrigeration equipment contains controlled substances (refrigerants) that must be recovered by a certified technician before disposal. Recovery and disposal costs are typically $100–$300 per unit. Replacement cost is the CapEx for the next unit, offset by any trade-in or scrap value (usually minimal).
For TCO comparison purposes, the relevant metric is annualized replacement cost: divide the replacement CapEx by the expected lifespan in years. A $2,000 chiller lasting 12 years has an annualized replacement cost of $167/year. A $1,200 chiller lasting 5 years has an annualized replacement cost of $240/year — meaning the “cheaper” unit is actually more expensive on a per-year basis.
TCO Comparison: Chiller vs Consumable Methods
The TCO framework becomes most powerful when used to compare recirculating chillers against consumable cooling methods (tap water, dry ice) that have no CapEx but high ongoing costs:
| TCO Component (10-year) | Tap Water | Dry Ice (8 kg/day) | Chiller ($2,200) |
|---|---|---|---|
| CapEx | $0 | $400 | $2,200 |
| Energy | $0 | $0 | $1,200–$2,400 |
| Consumables/water/dry ice | $13,000–$69,000 | $70,000–$200,000 | $800–$2,300 |
| Labor (handling/prep) | $2,000–$5,000 | $37,500 | ~$0 |
| Maintenance | $1,000–$4,000 (descaling) | $0 | $500–$1,500 |
| Disposal/replacement | $0 | $0 | $200 |
| 10-year TCO | $16,000–$78,000 | $107,900–$237,900 | $4,900–$8,600 |
The chiller’s 10-year TCO is 70–97% lower than dry ice and 46–89% lower than tap water cooling. The higher the consumption rate and the longer the planning horizon, the more dramatic the chiller’s advantage becomes.
COP and Energy Efficiency: Why It Matters for TCO
The Coefficient of Performance (COP) measures how many watts of cooling a chiller delivers per watt of electrical input. A COP of 2.5 means the chiller removes 2.5W of heat for every 1W of electricity consumed.
COP affects the energy component of TCO directly. Comparing two chillers with different COP values but the same cooling output:
| Parameter | Chiller A (COP 2.0) | Chiller B (COP 3.0) |
|---|---|---|
| Cooling output needed | 1,000W | 1,000W |
| Electrical input | 500W | 333W |
| Annual electricity (2,000 hrs, $0.12/kWh) | $120 | $80 |
| 10-year electricity | $1,200 | $800 |
| Difference | $400 over 10 years | |
For small chillers, the COP-driven energy difference ($40/year) is modest. But for larger systems running at higher loads and longer hours — particularly in institutional settings with 10+ chillers — the aggregate savings justify selecting higher-COP equipment even at a price premium.
BLDC variable-speed compressors typically achieve 15–30% higher seasonal COP than fixed-speed equivalents, primarily because they operate at optimal efficiency during partial-load conditions rather than cycling on and off at full capacity.
Procurement Decision Framework
For procurement teams evaluating cooling equipment purchases, the following framework structures the decision process:
- Define the requirement: What temperature range, cooling capacity, and precision does the application need? This determines the equipment class and narrows the field.
- Calculate the baseline cost: What is the current annual cost of cooling (consumables + labor + utilities)? This establishes the savings potential of switching to a chiller.
- Build the TCO comparison: Project 5-year and 10-year costs for the current method and the proposed chiller, including all five TCO components. Use conservative estimates — they are more credible to decision-makers.
- Compute payback period: Divide the chiller’s net CapEx (purchase price minus any Year 1 consumable savings) by the annual net savings. Payback under 12 months is a strong approval case; under 6 months is compelling.
- Quantify non-financial benefits: Temperature precision, regulatory compliance, safety improvement, water conservation, researcher productivity. These factors often tip the decision when the financial case alone is marginal.
- Consider lifecycle and warranty: A chiller with a 3-year warranty and 30,000+ hour rated compressor life reduces replacement risk and total lifecycle cost compared to unwarranted or short-lived alternatives.
Warranty and Service: Hidden TCO Differentiators
Two chillers with identical specifications and similar purchase prices can have dramatically different TCO outcomes based on warranty coverage and service support:
- Warranty duration: A 3-year comprehensive warranty (parts + labor + compressor) versus a 1-year limited warranty changes the risk profile significantly. For a chiller expected to last 12+ years, the warranty period represents the highest-risk portion of ownership — when manufacturing defects are most likely to manifest.
- Compressor warranty: Some manufacturers offer extended compressor warranties (5–7 years) separately from the general equipment warranty. Since the compressor is the most expensive single component (typically 30–40% of unit cost), this coverage substantially reduces replacement risk.
- Service availability: Manufacturers with local service partners or trained distributor networks can resolve issues in 1–3 days. Manufacturers with service only at the factory may require 2–4 weeks of round-trip shipping, during which the lab has no cooling.
- Parts availability: Manufacturers who stock replacement parts (pumps, controllers, fans) for expedited shipping minimize downtime when repairs are needed outside warranty.
When building a TCO comparison between competing products, request warranty documentation, service network information, and spare parts availability from each manufacturer. The lowest purchase price with the weakest warranty often produces the highest TCO.
Selecting Cost-Effective Cooling Equipment
The RIGID MidiCool™ series (1,300W–4.6kW, from $2,200) and MiniCool™ series (450W–1kW+, from $1,500) are designed to deliver the lowest total cost of ownership in their respective capacity classes. BLDC variable-speed compressors optimize energy efficiency across all operating conditions, and the closed-loop design eliminates water waste and consumable coolant costs. Both series cover 0°C to -40°C with ±0.1°C stability — the performance envelope required for the majority of laboratory cooling applications.
Institutional Scale: TCO for Multi-Chiller Deployments
The TCO advantage of recirculating chillers scales linearly with the number of instruments — but institutional procurement often introduces additional considerations:
Volume Purchasing
Institutions purchasing 5–20 chillers simultaneously can typically negotiate 10–20% volume discounts from manufacturers. This reduces the CapEx component of TCO and shortens the payback period even further. Some manufacturers also offer extended warranty packages for institutional purchases, reducing the risk component of the TCO calculation.
Standardization Benefits
Standardizing on a single chiller platform across the institution provides TCO benefits beyond unit pricing:
- Spare parts inventory: One set of spare parts (pump seals, air filters, coolant) serves all units, reducing inventory costs and storage requirements.
- Maintenance training: Facility staff learn one maintenance procedure rather than multiple procedures for different equipment brands and models.
- Interchangeability: If one unit fails, a backup from another lab can serve as temporary replacement without compatibility concerns.
- Simplified procurement: Reorders use the same purchase order template, reducing administrative overhead.
Lifecycle Management
For institutions with 10+ chillers, implementing a lifecycle replacement schedule prevents the “all units fail simultaneously” scenario that occurs when equipment is purchased in a single batch and ages uniformly. Staggering replacements — replacing 2–3 units per year rather than all 10 at once — smooths the CapEx impact across budget cycles and ensures that the fleet always includes some recently purchased, warranty-covered units.
Risk-Adjusted TCO: Accounting for Supply Chain and Safety
Standard TCO calculations capture predictable costs but may understate the value of eliminating supply chain and safety risks. A risk-adjusted TCO includes probability-weighted costs for adverse scenarios:
- Dry ice supply disruption: If a 2-week dry ice shortage occurs once every 3 years, the expected cost includes idle researcher time (2 weeks × $40–$80/hr × 8 hrs/day × 10 days = $3,200–$6,400 per researcher affected), reagent waste from interrupted experiments, and emergency procurement at premium pricing. Probability-weighted annual cost: $1,000–$2,000.
- Safety incident: A CO₂-related safety event (even a near-miss that triggers a safety investigation) can cost $5,000–$20,000 in investigation time, corrective actions, and potential regulatory response. Probability is low but impact is high.
- Water damage: A burst hose or disconnected tap water line can cause significant damage to laboratory equipment, records, and building infrastructure. Even minor water damage events typically cost $2,000–$10,000 in cleanup and equipment repair.
When these risk-adjusted costs are included, the TCO advantage of recirculating chillers becomes even more pronounced — particularly for institutions with regulatory oversight or high-value ongoing research programs.
Frequently Asked Questions
How do I estimate my current dry ice or water cooling cost if we don’t track it separately?
For dry ice: check procurement records for dry ice purchase orders over the past 6–12 months. Include delivery charges (often on separate invoices). For technician labor, estimate 20–30 minutes per day for preparation and handling, multiplied by the fully loaded labor rate. For tap water: check the building utility bill for water and sewer charges, then estimate the fraction attributable to laboratory cooling based on flow rate and hours of operation. Even rough estimates are useful — the cost differentials are large enough that precision in the second decimal place is unnecessary.
What discount rate should I use for TCO calculations?
For academic and government institutions, a 3–5% real discount rate (above inflation) is standard for equipment investment analysis. For private companies, use the organization’s weighted average cost of capital (WACC), typically 8–12%. In practice, chiller payback periods are so short (3–12 months) that the discount rate has minimal impact on the investment decision — the savings overwhelm the time value of money at any reasonable rate.
Should I buy the cheapest chiller that meets the technical specification?
Not necessarily. The lowest purchase price often correlates with shorter compressor life, lower COP, less durable components, and shorter or no warranty coverage. A chiller that costs 30% more but lasts twice as long and uses 20% less electricity will have a significantly lower TCO over its lifecycle. Evaluate total cost of ownership, not just purchase price.